
Why Vertical Ratio is the North Star of Your Post-Bike Run
Every triathlete knows the "jelly leg" phenomenon coming out of T2. You rack your bike, lace up, and for the first ten minutes, your body feels like it's operating on a different frequency. This period of neuromuscular settling is where races and PRs can be won or lost. Go too hard, and you redline before your gait stabilizes; be patient, and you set the stage for a strong finish.
In a brick session (1-hour Zone 2 bike followed by a run), a Team Podium Racing athlete focused on exactly that: patience. Using the data from their Suunto Race 2 and Stryd Duo pods, they were able to dig into why Vertical Ratio is the ultimate metric for measuring this transition.
The Anatomy of the Build
Looking at the data from yesterday’s run, there is a clear progression. They didn't chase a pace out of T2. Instead, they allowed the power and speed to climb naturally as their nervous system "remembered" how to run.
| Phase | Avg Power (w/kg) | Avg Speed ((m/s) | Vertical Ratio |
|---|---|---|---|
| Initial (Settling) | ~2.6 – 3.2 | 2.5 – 2.9 | ~8.5% |
| Mid (Steady) | ~3.5 – 3.8 | 3.3 – 3.6 | ~7.2% |
| Finish (Progression) | ~4.2+ | 3.8+ | < 6.5% |
As the run progressed, they paid attention to the power on the Suunto Race 2 and let their body settle into a comfortable rhythm. A good sign that they were delivering more power efficiently can be seen as the "cost of travel" went down.
Why Vertical Ratio is the "Truth" Metric
Many runners fixate on Cadence or Ground Contact Time (GCT). While the data shows that their cadence remained a bit lower than their ultimate goal, and their GCT was slightly on the "long" side, these metrics only tell part of the story. Vertical Ratio is the cost-benefit analysis of your stride. It compares your Vertical Oscillation (how much you bounce) to your Stride Length.
Vertical Ratio = (Vertical Oscillation / Stride Length) × 100
Yesterday's data revealed something crucial: even though the athlete’s feet were spending more time on the ground than they may like, their Vertical Ratio was in a good spot (dipping into the 6% range toward the end). This tells us that the combination of their stride length and vertical oscillation was optimized. They were not wasting energy jumping into the air; they were directing it forward.
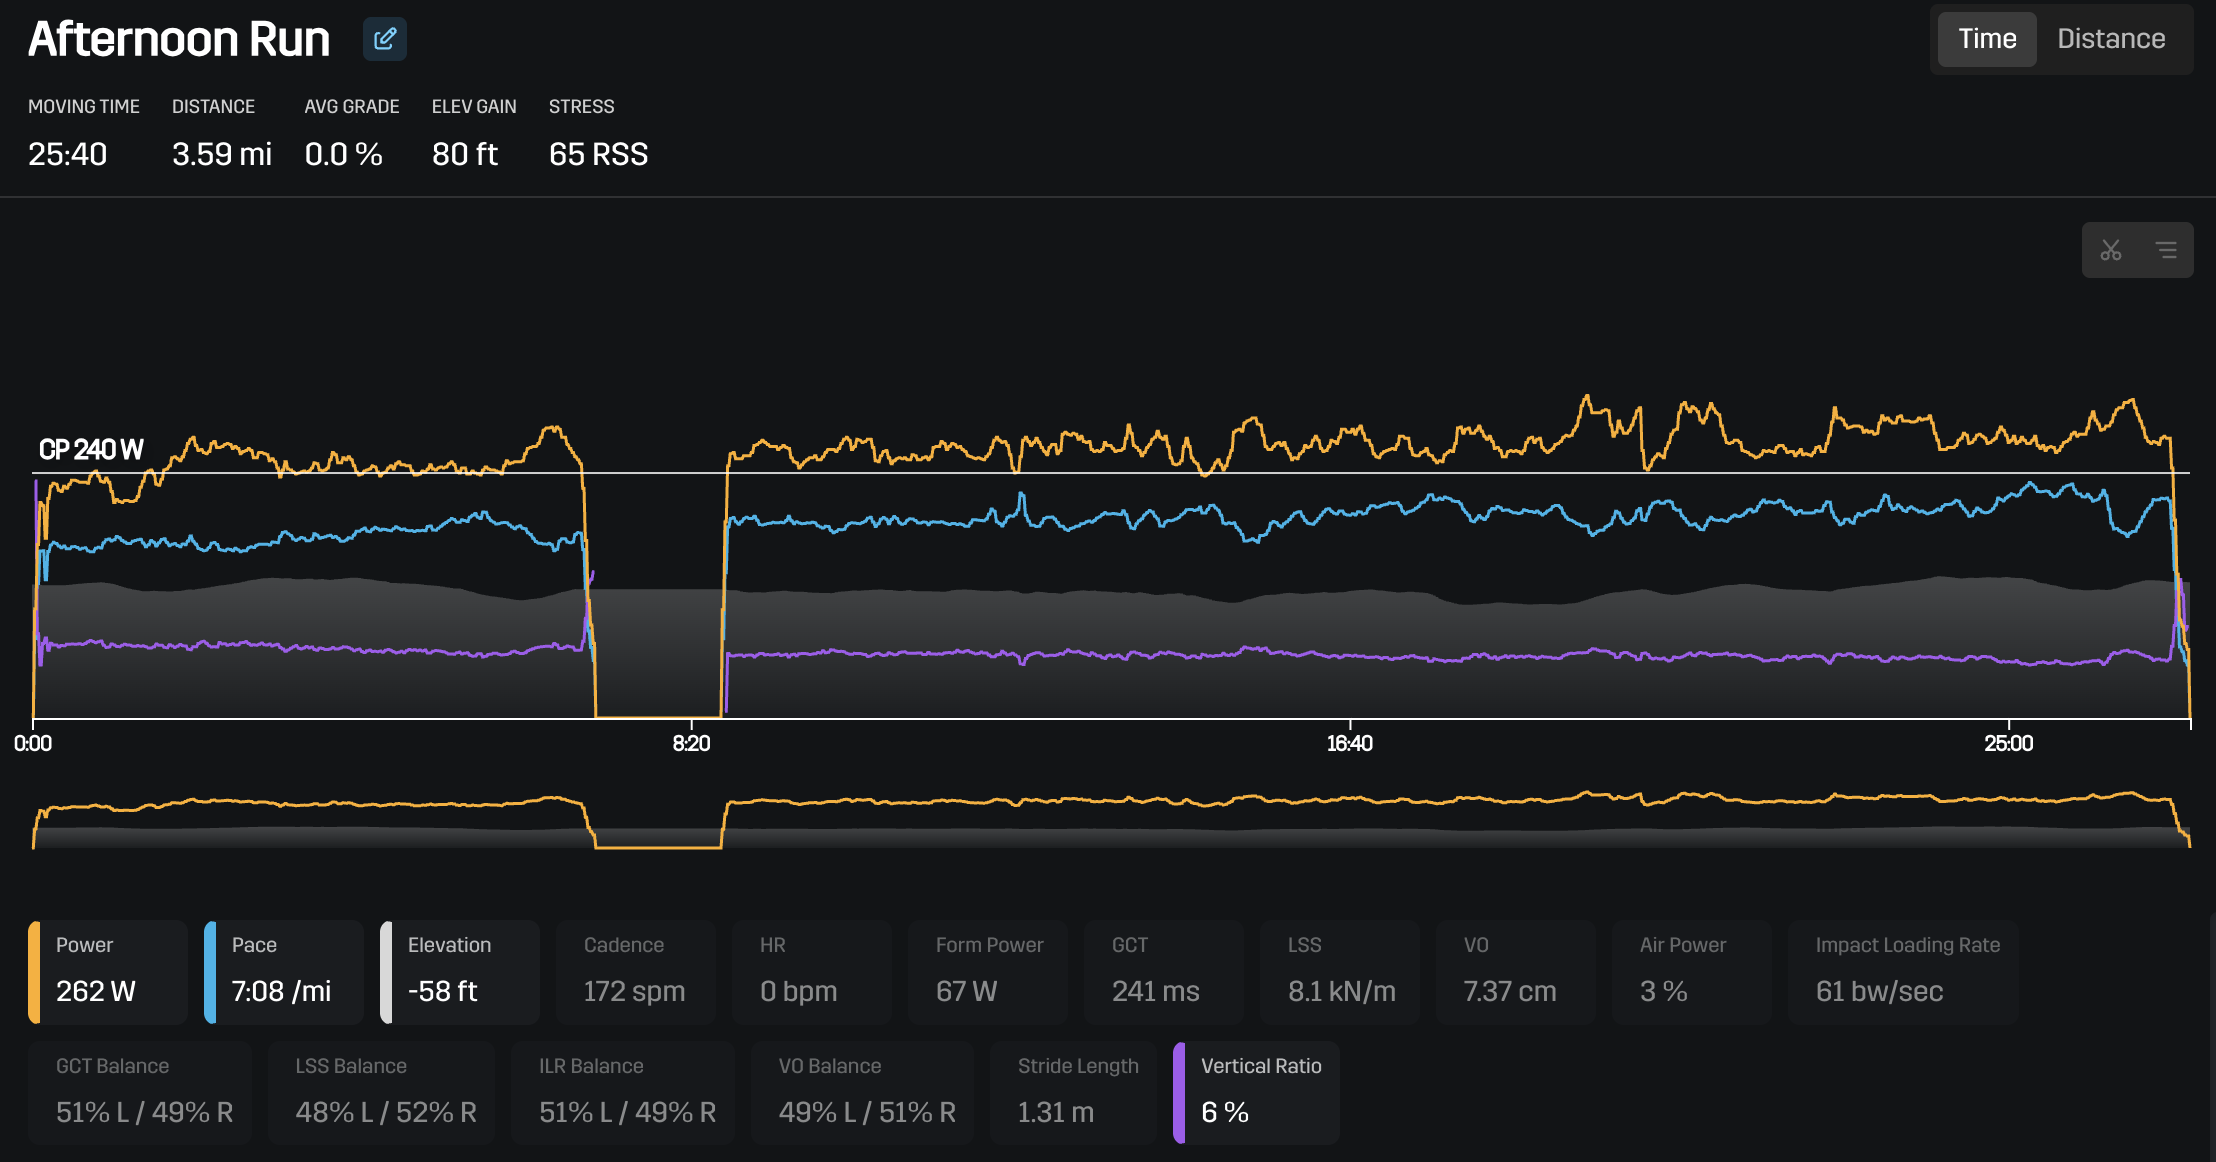
By the end of the run, the Vertical Ratio was at 5%
The Power of the Suunto Race 2 + Stryd Ecosystem
For triathletes, quantifying the "feel" of a brick run is the only way to improve it. The integration between the Suunto Race 2 and Stryd provides a high-fidelity look at your biomechanics that heart rate alone cannot touch.
Quantifying the Settling Period: You can actually see the moment your Vertical Ratio stabilizes after the bike. This allows you to create a data-backed pacing strategy for T2.
Identifying "Wasted" Watts: Stryd's Air Power and Form Power metrics, combined with Suunto’s clear UI, let you see if your increased effort is going into speed or just unnecessary vertical bounce.
Corrective Cues: If your Vertical Ratio is high but your power is low, you know you need to work on your "spring" (Leg Spring Stiffness) rather than just trying to move your legs faster.
Final Thought: Patience Pays
The biggest takeaway from this run? Don't fight the bike legs. Be patient and allow the effort to progress while your biomechanics find their rhythm. This athlete’s Vertical Ratio proved that even when the cadence wasn't "perfect," the efficiency remained on target. If you aren't tracking your Vertical Ratio, you’re missing the most important indicator of whether you’re running harder or running smarter.